

The S&P 500 continued its string of negative weeks, dropping 3% last week. It was the seventh straight weekly decline in the index of large-cap stocks. The S&P 500 temporarily fell more than 20% on Friday, but the market rallied and the index finished down 18.1% from its January all-time high.
Key Points for the Week
- The S&P 500 declined for the seventh straight week and narrowly missed entering a bear market.
- Retail sales climbed 0.9% showing the consumer remains willing to buy items even as prices have increased.
- Retailers struggled with higher labor and shipping costs and uncertain supply chains. Earnings dropped while sales increased.
Poor earnings at big-box retailers caused much of the market decline. Wednesday’s slide of 4% was the result of a second straight day in which a major retailer announced earnings would miss expectations. Companies cited high labor costs, head counts, and shipping prices as reasons for the poor quarterly performance.
One factor companies didn’t cite was low sales. April retail sales confirmed the trend of improvement, rising 0.9%. Increased auto sales and more money spent on dining out contributed to strong monthly spending. While spending on goods and services is increasing, homebuyers seem to be slowing their purchases. Single-family housing starts fell 7.3% last month, and existing home sales fell 2.4%. Higher mortgage rates are a top reason for the decline.
Industrial production showed similar strength to retail sales, jumping 1.1% in April. Manufacturing climbed 0.8% and reached its highest level since 2008.
The MSCI ACWI dropped 1.1% as big-box retailers’ poor earnings didn’t hit global stocks as hard as they did U.S. stocks. Bonds helped cushion the decline. The Bloomberg U.S. Aggregate Bond Index rallied 0.6%. The PCE deflator, which measures inflation, and some key trade data are the top economic releases this week.
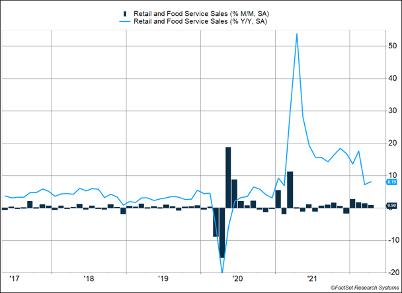
Figure 1
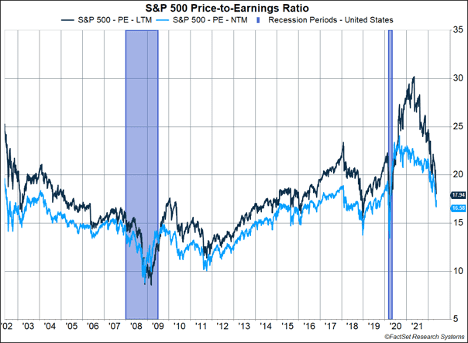
Figure 2
Stocks on Sale?
Market volatility continued to make things difficult for equity investors. Seven straight weeks of losses in the S&P 500 make this a tough market for many. The last market peak was on the second day of the year, more than four-and-a-half months ago. Compared to the decline in March 2020, this one is shallower but has lasted much longer. In 2020, stocks fell 34% in just more than a month. It was a much sharper downturn, but it didn’t require the same level of patience before it started moving higher.
The biggest reason for the slide was poor first-quarter results by big-box retailers, which earned that moniker for the box-like appearance of their stores. The weak results were caused by the challenges reverberating through our economy. Wages have climbed rapidly. Firms have hired extra workers at higher wages to meet demand. The supply challenges have been two-fold. Some items arrived late and missed their prime selling season, resulting in lost sales. Companies then began ordering goods further in advance to make sure they arrived on time. But sometimes they arrived too early, leaving the company with inventory and storage costs that cut into profitability.
The good news for retailers is the consumer remains well positioned to spend. April retail sales in the U.S. beat expectations and rose 0.9%. March sales growth was revised upward from 0.7% to 1.4%, confirming strong consumer demand. The biggest contributor to overall retail sales was auto sales, which is a good sign since automobile prices have increased rapidly. The industrial production report confirmed that auto manufacturing is back to levels seen prior to the COVID-19 crisis.
Sales at restaurants increased 2% in April month-over-month and are now up nearly 20% since last year. Inflation is driving the spike, but it’s also a sign that the food services industry is finally getting back to normal after several fits and starts caused by new COVID strains. At the same time, sales at grocery stores decreased slightly in April, another sign that Americans are getting more comfortable with going out to eat again.
These strong retail sales numbers certainly point to a very strong U.S. consumer. The increases are not just because Americans are buying the same amount of goods that are now more expensive. The real retail sales figure increased 0.6% last month and has gone up 1.6% in the past three months.
Because inflation is high at the same time the economy is slowing, the path to a market recovery has challenges on both sides. On one side is inflation. There is very little indication that consumer demand will decline soon, which means price pressures could continue. The other side is a recession, which may occur if interest rate hikes and other factors slow the economy too much. In between is the soft landing the Fed hopes to engineer.
When markets fall, many believe bad outcomes become more probable. Our view is the width of the path to success widens when markets go down because valuations are falling. As Figure 2 shows, the price investors pay for a dollar of earnings has declined to around the average level from 2015-2019. Compared to the heightened valuations caused by earnings declines from the pandemic, current valuations are lower. Lower valuations mean less optimism about how companies will fare in the future. When valuations drop, it means expectations are dropping as well, and that means pretty good numbers can become “good enough” and stocks can increase.
Will stocks avoid breaching the 20% threshold? By the time you read this, they may already have. Rather than get caught up in the negative sentiment created by the market falling another percent or two, focus on the fact that value is improving, and the seeds of the next market rally may have already been planted. That perspective can keep you invested and prepared to reap the rewards if stocks are on sale.
–
This newsletter was written and produced by CWM, LLC. Content in this material is for general information only and not intended to provide specific advice or recommendations for any individual. All performance referenced is historical and is no guarantee of future results. All indices are unmanaged and may not be invested into directly. The views stated in this letter are not necessarily the opinion of any other named entity and should not be construed directly or indirectly as an offer to buy or sell any securities mentioned herein. Due to volatility within the markets mentioned, opinions are subject to change without notice. Information is based on sources believed to be reliable; however, their accuracy or completeness cannot be guaranteed. Past performance does not guarantee future results.
S&P 500 INDEX
The Standard & Poor’s 500 Index is a capitalization-weighted index of 500 stocks designed to measure performance of the broad domestic economy through changes in the aggregate market value of 500 stocks representing all major industries.
MSCI ACWI INDEX
The MSCI ACWI captures large- and mid-cap representation across 23 developed markets (DM) and 23 emerging markets (EM) countries*. With 2,480 constituents, the index covers approximately 85% of the global investable equity opportunity set.
Bloomberg U.S. Aggregate Bond Index
The Bloomberg U.S. Aggregate Bond Index is an index of the U.S. investment-grade fixed-rate bond market, including both government and corporate bonds.
https://www.cnbc.com/2022/05/17/stock-market-news-open-to-close.html
https://www.census.gov/retail/marts/www/marts_current.pdf
https://www.federalreserve.gov/releases/g17/current/g17.pdf
https://www.nar.realtor/newsroom/existing-home-sales-retract-2-4-in-april
https://www.census.gov/construction/nrs/pdf/newressales.pdf
Compliance Case #01379847
